# take care of missing data missing_data_df = dataset.isnull().sum() missing_data_df
由上图可见,动机这个字段大部分是缺失的;有1237起事件,要么死亡人数未知,要么受伤人数未知。
2 探索数据集
探索发生恐怖事件数量最多的国家,代码如下:
1 2 3 4 5
# statistics by country/region stats_with_country = dataset['Country'].value_counts() # count group by stats_with_country = stats_with_country.reset_index() stats_with_country.rename(columns={'index':'Country', 'Country':'Count'}, inplace = True) print('%s has most terrorism counts. The number is %d' %(stats_with_country.iloc[0,0], stats_with_country.iloc[0,1]))
我们发现伊拉克是发生恐怖袭击次数最多的国家。
探索发生恐怖事件数量最多的地区,代码如下:
1 2 3 4
stats_with_region = dataset['Region'].value_counts() stats_with_region = stats_with_region.reset_index() stats_with_region.rename(columns={'index':'Region', 'Region':'Count'}, inplace = True) print('%s has most terrorism counts. The number is %d' %(stats_with_region.iloc[0,0], stats_with_region.iloc[0,1]))
我们发现中东&北非地区是发生恐怖袭击次数最多的地区。
伊拉克是发生恐怖袭击次数最多的国家。哪个国家是死亡人数最多的国家?代码如下:
1 2 3 4
stats_with_killed = dataset.groupby(['Country'])[['Killed']].sum() stats_with_killed = stats_with_killed.reset_index() stats_with_killed = stats_with_killed.sort_values(['Killed'], ascending=[False]) print('%s killed most people. The killed people number is %d' %(stats_with_killed.iloc[0,0], stats_with_killed.iloc[0,1]))
由上图可知,死亡人数最多的国家也是伊拉克。
在发生的13490次恐怖事件中,哪次事件杀死了最多的人?代码如下:
1
2
3
4
5
max_killed_index = dataset.loc[dataset['Killed'].idxmax()] max_killed_year = max_killed_index.Year max_killed_country = max_killed_index.Country max_killed_number = max_killed_index.Killed print('In all terrorism events, this event killed most people. In %s, %s killed %d' %(max_killed_year, max_killed_country, max_killed_number))
由上图可知,2016年叙利亚恐怖主义事件死亡了433人,是最惨的一次事件。
身在中国,我们很关心自己国家的状况。代码如下:
1 2
china_killed_people = stats_with_killed.query('Country == "China"').iloc[0,1] print('In China, %d people are killed during all the terrorism events.' %(china_killed_people))
由上图可知,虽然中国也有恐怖主义事件,但是死亡人数非常少。
3 可视化数据集
可视化发生恐怖主义事件次数最多的10个国家,代码如下:
1 2 3 4 5
# visualize them (top 10) plt.figure() plt.title('Country vs Count') plt.xticks(rotation = 90) ax = sns.barplot(x = 'Country', y = 'Count', data = stats_with_country.iloc[0:10, :])
图37 执行结果
由上图可知,伊拉克排第一,叙利亚排第十。
可视化发生恐怖主义事件次数最多的10个地区,代码如下:
1
2
3
4
plt.figure() plt.title('Region vs Count') plt.xticks(rotation = 90) ax = sns.barplot(x = 'Region', y = 'Count', data = stats_with_region.iloc[0:10, :])
图38 执行结果
由上图可知,中东&北非地区最乱。
可视化发生恐怖主义事件死亡人数最多的10个国家,代码如下:
1 2 3 4
plt.figure() plt.title('Country vs Killed') plt.xticks(rotation = 90) ax = sns.barplot(x = 'Country', y = 'Killed', data = stats_with_killed.iloc[0:10, :])
# statistics by attack type plt.figure() plt.title('Attacy Methods by Terrorists') plt.xticks(rotation = 90) sns.countplot(x = 'AttackType', data = dataset, order = dataset['AttackType'].value_counts().index)
图40 执行结果
由上图可知,炸弹袭击最普遍,可能这样造成的伤亡大。
可视化目标人群类型排名,代码如下:
1
2
3
4
5
# statistics by target type
plt.figure()
plt.title('Favorite Targets')
plt.xticks(rotation = 90)
sns.countplot(x = 'TargetType', data = dataset, order = dataset['TargetType'].value_counts().index)


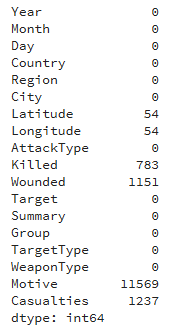


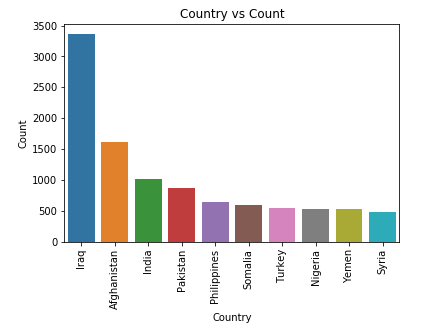 图37 执行结果
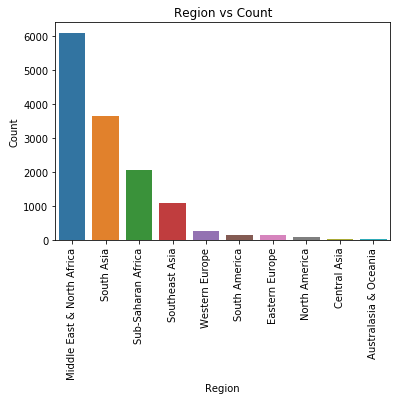 图38 执行结果
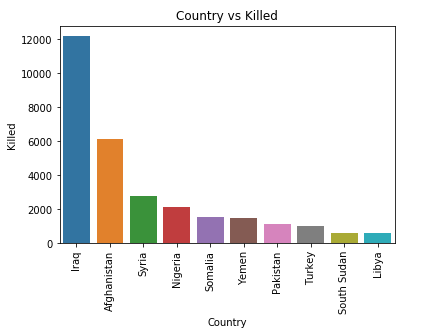 图39 执行结果
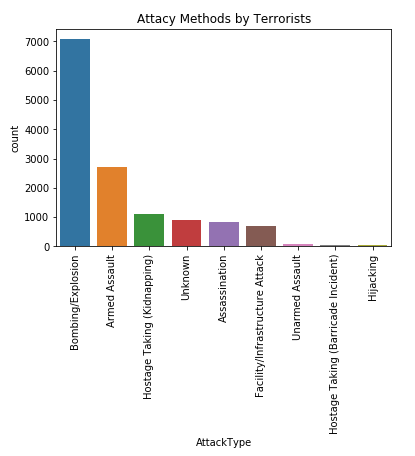 图40 执行结果
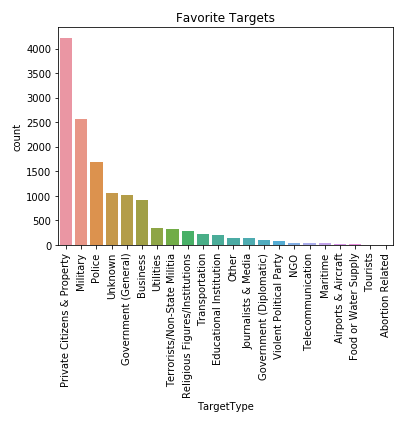 图41 执行结果


